

What a Redlining Review Covers
Last updated: September 15, 2026
Six pieces of analysis, each of which an examiner runs, and none of which means much on its own.
One note on the vocabulary, since we checked: “penetration” appears in neither the Interagency Fair Lending Examination Procedures nor the OCC’s handbook. It is vendor shorthand, not examiner language. We use it below because it is the term the industry and most RFPs use, but the underlying examiner question is simply how your lending is distributed across tracts compared with your peers. The primary sources are quoted here.
Majority-minority tract penetration
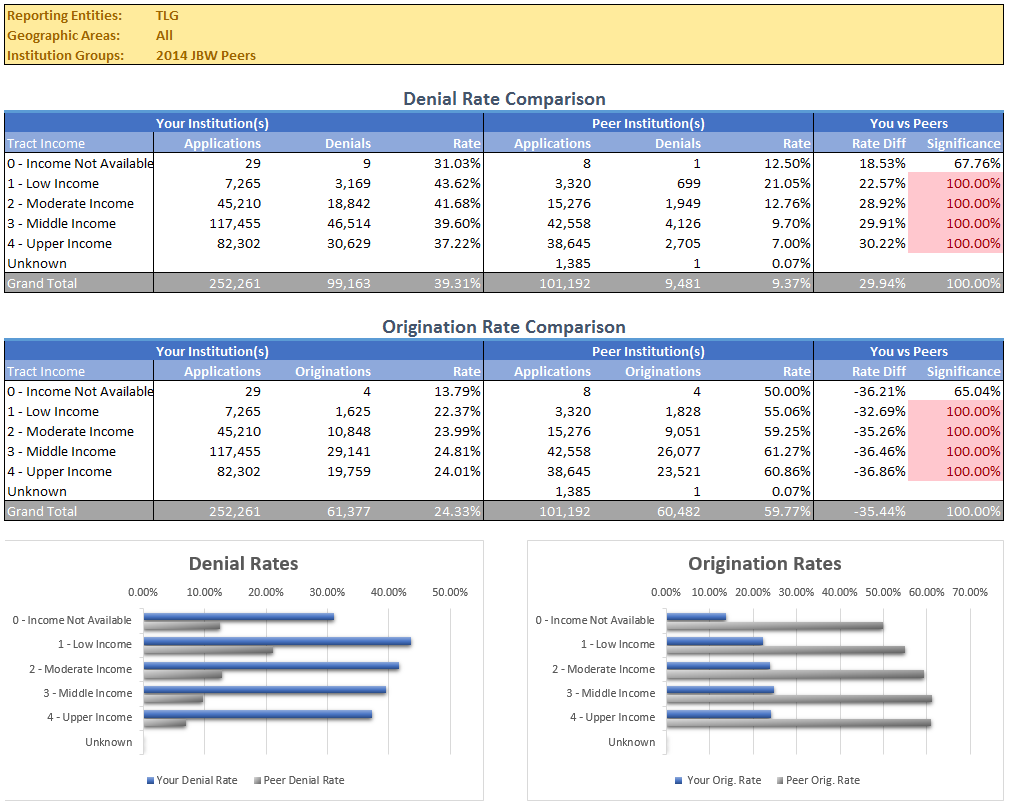
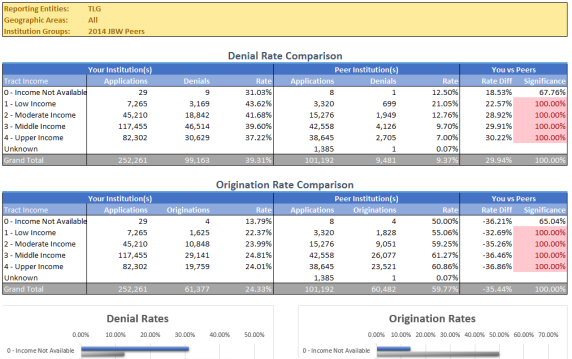
Applications and originations by census tract minority level, so the distribution of your lending is visible as a distribution rather than a total. This is the figure a redlining review opens with, and the one a board paper needs before anyone can discuss it. Screenshot.
Assessment area against REMA
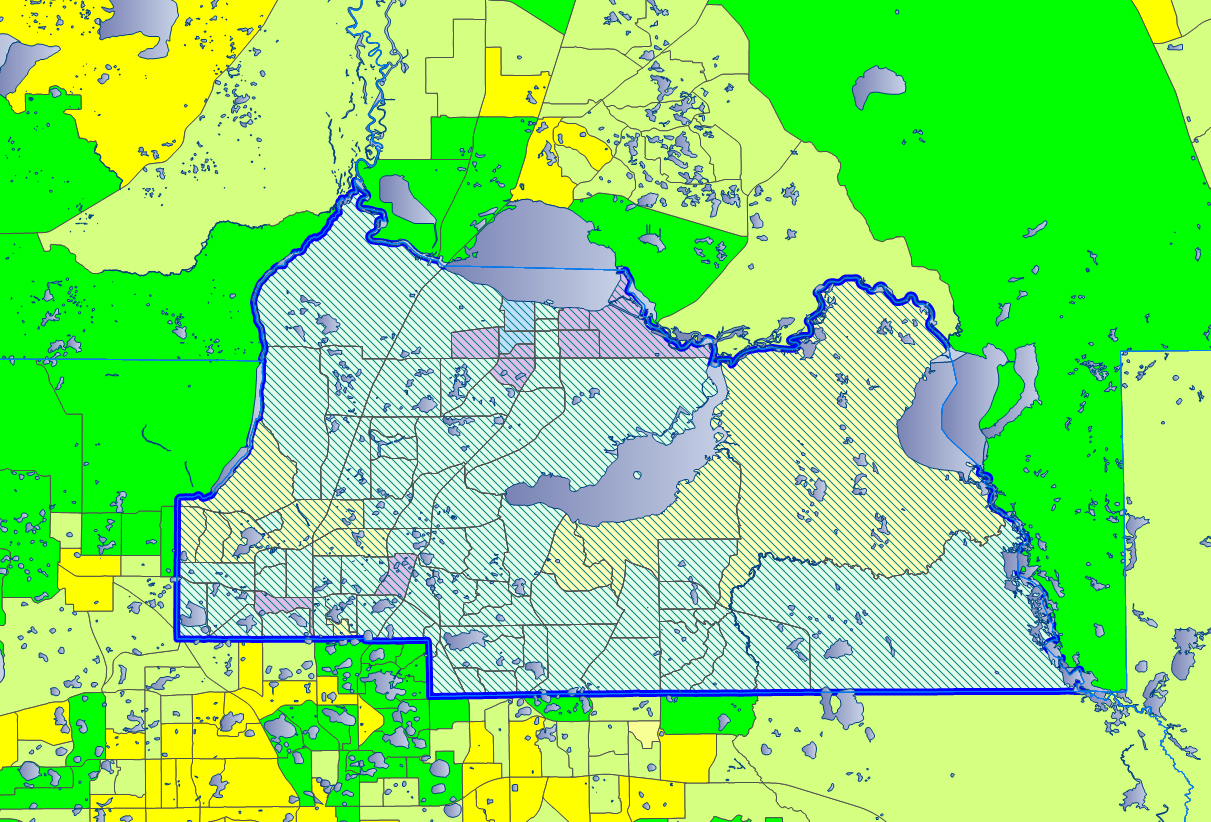
Run the same analysis against the CRA assessment area you drew and against a wider reasonably expected market area, and compare the two answers. The Interagency Procedures tell examiners to consider whether an assessment area may be too limited, which makes the boundary itself something to test rather than something to assume. Screenshot.
Peer and market-share comparison
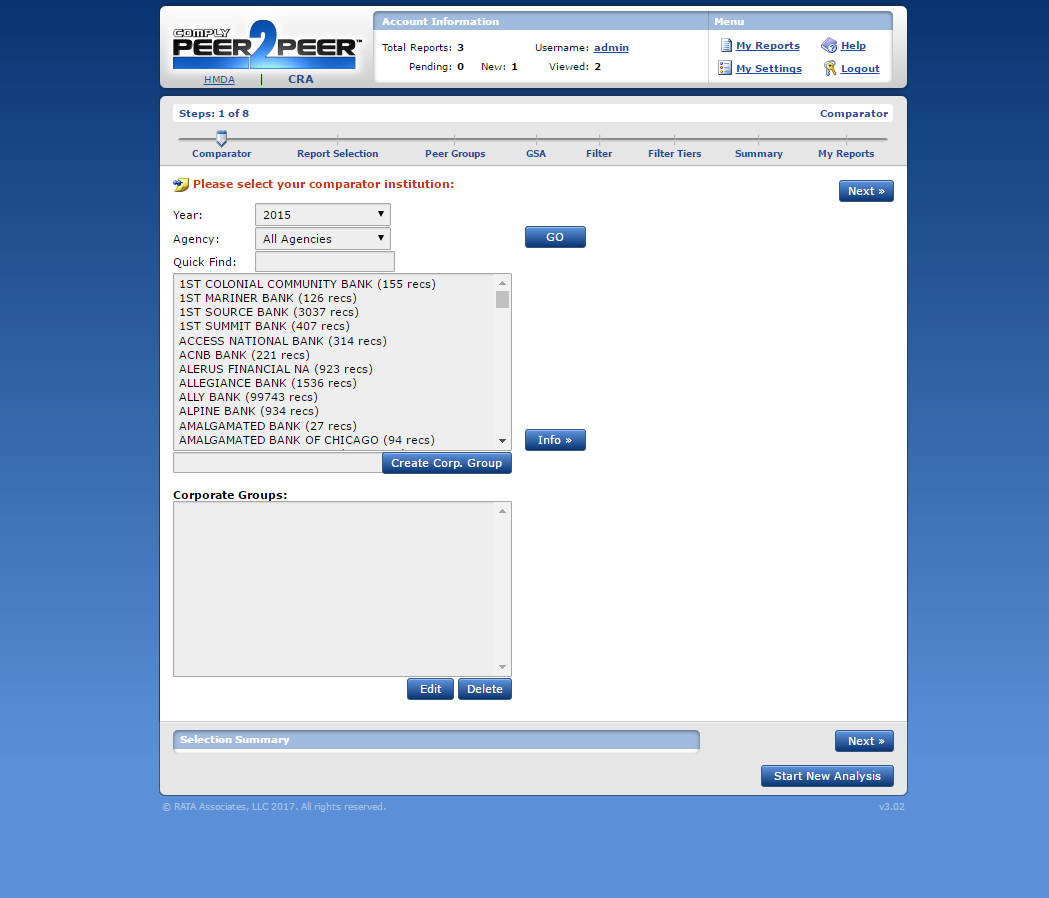
Build the peer group on your own criteria — asset size, geographic presence, regulatory agency, lending volume — then measure your share of lending in each tract against it. Peers are the control group that turns a thin record into either an explanation or a finding. Screenshot.
Branch and ATM geography
Map your branch and ATM network against tract demographics and against your assessment area, with FDIC Summary of Deposits data alongside it. Physical presence is one of the first things an examiner overlays on a lending map, because it is the most common innocent explanation and the most common aggravating one. Screenshot.
Tract shading and visual pattern
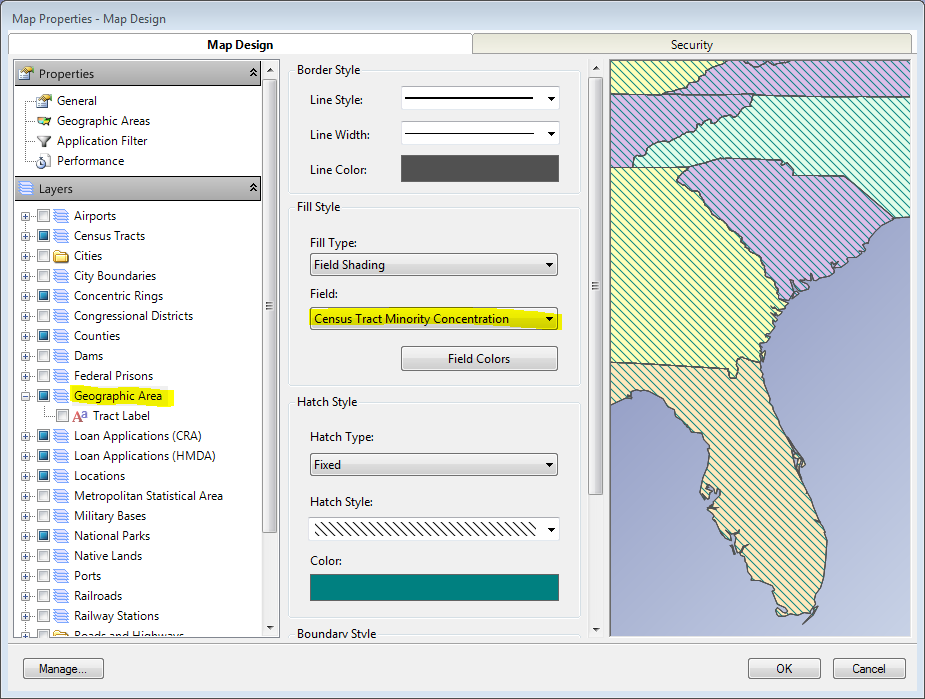
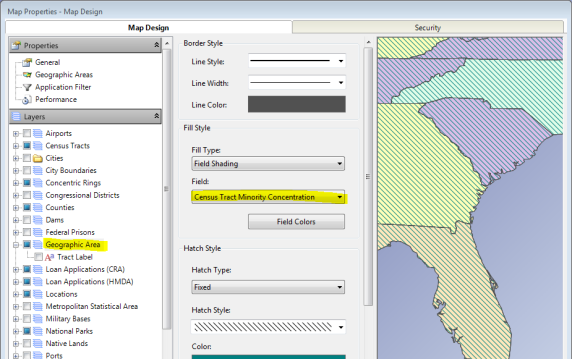
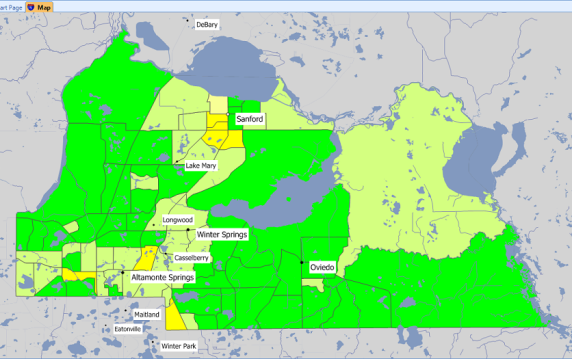
Shade tracts by minority population, income level or your own lending volume and see the pattern geographically, because a table of tract numbers hides the shape that a map makes obvious. Overlay borders, points and polygons to show where the lending stops and whether anything on the ground explains it. The mapping demo builds census tract and demographic overlays on the map from live data, over whichever assessment-area geography you name. Screenshot.
Scored, then drilled into
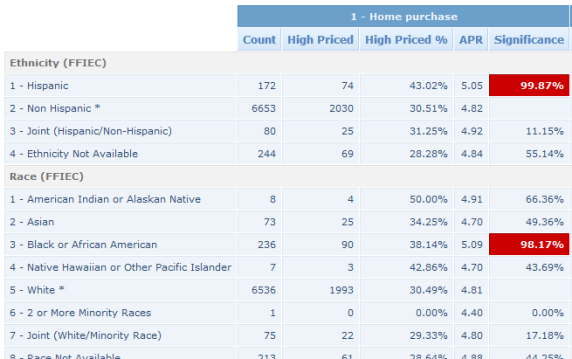
Redlining sits as a scored factor in the twelve-factor risk scorecard, so it is tracked cycle to cycle rather than investigated once. Click through any figure to the applications underneath it and open a comparative file review from there, which is how a geographic pattern becomes an answerable question. Screenshot.
Where the Analysis Actually Runs
Redlining analysis is not a separate Comply product. It is these four, doing what they already do, pointed at a geographic question.
Comply Fair Lending
Tract-level penetration, redlining as a scored risk factor in the twelve-factor scorecard, statistical significance testing, and drill-through from any cell to the applications behind it.
Comply Peer-2-Peer
Peer group construction on criteria you set, then market share, ranking and performance comparison by geography — the control group the whole argument rests on.
Comply Mapping
Assessment area and REMA boundaries, tract shading by demographic or lending volume, branch and ATM overlays, and FDIC Summary of Deposits data on the same map.
Comply DataMine
Custom tables and charts across your data and nationwide peer submissions, for the specific cut of the geography nobody wrote a standard report for.
Geography is one line of enquiry inside a wider review, and it is rarely the one an examiner opens with. The order the rest of them run in is set out in our step-by-step guide to running a fair lending self-assessment before an exam.
If you already license these, you already have the redlining review. If you are evaluating, that is one fewer line item and one fewer implementation than a vendor selling redlining as a module.
Frequently Asked Questions
The questions that come up in RFPs and in exam preparation, answered plainly.
Ask us directlyDoes RATA sell a separate redlining module?
No, and that is the point rather than a limitation. Redlining analysis in Comply is assembled from capabilities you already license: tract-level penetration and risk scoring in Comply Fair Lending, market share and peer selection in Comply Peer-2-Peer, assessment area and branch geography in Comply Mapping, and custom reporting in Comply DataMine. Some vendors package redlining as a discrete module and price it as an add-on. RATA does not, so there is nothing extra to purchase, implement or reconcile against the rest of your compliance data.
What is a reasonably expected market area (REMA)?
It is the area examiners consider an institution should reasonably have served, which can be wider than the CRA assessment area the institution drew for itself. The Interagency Fair Lending Examination Procedures direct examiners to consider whether an assessment area may be too limited, and where it is, the redlining analysis is run against the broader area instead. That matters because it means the boundary you drew is itself part of what gets examined. Comply runs the same penetration and peer comparisons against either geography, so you can see both answers before an examiner picks one.
How does Comply identify redlining risk?
Through the components a redlining review is actually made of, rather than a single score. Penetration into majority-minority census tracts, application and origination volume inside versus outside the assessment area and the reasonably expected market area, market share against a peer group you define, branch and ATM locations mapped against tract demographics, and redlining as a scored factor in the twelve-factor risk scorecard. Every figure drills through to the applications behind it, because a pattern is where a redlining review starts rather than where it ends.
Is redlining a form of disparate impact?
No. The Federal Reserve's Consumer Compliance Handbook classifies redlining as a form of illegal disparate treatment, and states that it may violate both the Fair Housing Act and the ECOA. The distinction is worth getting right because it changes what the analysis has to show: no evidence of intent is required, so the exposure is what the geographic distribution of your lending looks like rather than what anyone meant by it.
When is a redlining analysis not appropriate?
The Interagency Fair Lending Examination Procedures state that where there are no areas identifiable for their racial or national origin minority character within the institution's CRA assessment area or reasonably expected market area for residential products, a redlining analysis is not appropriate. They add that where there is a substantial but dispersed minority population, potential disparate treatment can instead be evaluated by a routine comparative file review of applicants. Redlining is a geographic argument, so it requires a geography to argue about, and knowing that is as useful as knowing how to run the analysis.
Can Comply compare our lending to peers by geography?
Yes, and for a redlining review it is the comparison that carries the argument. A thin record in a majority-minority tract means little in isolation and a great deal if comparable lenders in the same market are originating there. Comply Peer-2-Peer builds the peer group on criteria you set, including asset size, geographic presence, regulatory agency and lending volume, then produces market share and ranking against it. Being able to explain how the peer set was chosen matters as much as the result, because that is the first thing an examiner will ask about.
Redlining Resources
The guidance behind the analysis above, in the agencies’ own words, plus our own longer write-up of where the two geographies differ.
Redlining analysis: REMA vs assessment area
What examiners compare, why the assessment area you drew is itself examined, and where a reasonably expected market area comes from. Quotes the Interagency Procedures directly.
Federal Fair Lending Regulations and Statutes: Overview
The Consumer Compliance Handbook section that classifies redlining as a form of illegal disparate treatment under both the FHAct and the ECOA, and sets out the three types of proof of lending discrimination.
What regression can and cannot prove
Redlining findings are usually supported by statistical comparison, so the limits of that comparison matter. What a model establishes, what it does not, and the omitted-variable question examiners ask.
Compliance glossary
Definitions for REMA, assessment area, disparate treatment, disparate impact, matched-pair analysis and the statistical terms used above.
What Our Customers Say
Trusted by financial institutions nationwide for compliance excellence
“The folks at RATA were outstanding. Every time I had a question, I would speak to someone who either knew the answer immediately or could provide the answer within a very short period of time. Everyone I spoke with knew their product, industry and was willing to do whatever it took to help us solve our problem. I would highly recommend RATA and COMPLY to anyone who is considering this company and product.”
“The support has been exceptional. The program is very easy to use. RATA has been one of the best companies I have dealt with in my 25 years of banking. Their service has exceeded my expectations.”
“I wanted to let you know that RATA and Comply is the absolute best!!! My submission is complete and was accomplished in record time. I more than doubled the amount of activity I reported last year and it took me less than half the time. Thank you for being there for us and the industry! You are and always will be number one to me!!!”


 … and hundreds of others since 1987