
What Is an MSA? Metropolitan Statistical Areas, Census Tracts and Your Community Reinvestment Act (CRA) Assessment Area
Every HMDA and Community Reinvestment Act (CRA) record you file depends on a piece of geography most filers never look at directly: the Metropolitan Statistical Area. The MSA decides which median income a census tract is measured against, which boundaries your CRA assessment area has to respect, and whether a property needs geography fields on the HMDA register at all. Below: what an MSA is, how it fits with counties and census tracts, and what shifts in your data when OMB redraws one.
Key takeaways
- An MSA is a group of whole counties that the Office of Management and Budget (OMB) delineates around an urban core of 50,000 or more people. It is not a city limit.
- Census tracts sit inside counties, and counties make up MSAs, so every tract carries one state code, one county code and at most one MSA or metropolitan division (MD) code.
- A tract's CRA income level compares the tract's median family income with the median for its MSA or MD. An MSA change can reclassify a tract without anything in the tract changing.
- Under the CRA regulations in force today, an assessment area must consist of whole census tracts and may not extend substantially beyond an MSA or state boundary, except in a multistate MSA.
Need MSA, county and tract codes on every record? Schedule your free demo today.
What is a Metropolitan Statistical Area (MSA)?
A Metropolitan Statistical Area is a set of whole counties that OMB delineates around at least one urban area of 50,000 or more people, plus the adjacent territory that has "a high degree of social and economic integration with the core as measured by commuting ties." That is the definition in OMB Bulletin No. 23-01, the current delineation bulletin, issued July 21, 2023.
The Census Bureau's metro and micro area page explains how the counties are chosen. A county where at least half the population lives in urban areas of 10,000 or more, or that has at least 5,000 people living in a single such urban area, is a "central county." Other counties join as "outlying counties" if enough of their residents commute to or from the central counties. The Bureau calls counties the "building blocks" of these areas.
So an MSA usually takes in suburbs, small towns and farmland well past the city it is named after. The Census page notes that an MSA's title lists up to three principal cities and every state the area extends into. The bulletin counts 387 MSAs in the United States and 6 in Puerto Rico, and says 1,186 of the 3,144 U.S. counties sit inside one.
OMB draws these areas for statistics. Bulletin 23-01 says they are "not intended for any public or private sector non-statistical uses" and that any agency using them in a program is responsible for making sure they fit. The CRA regulations use them anyway. The Federal Reserve's version defines an MSA as "a metropolitan statistical area as defined by the Director of the Office of Management and Budget" (12 CFR 228.12(r)), and Regulation C uses the same OMB definitions for MSAs and MDs (12 CFR 1003.2(m)).
MSA vs. metropolitan division vs. micropolitan area vs. nonmetropolitan county
Four labels come up in CRA and HMDA work. All of them are built from whole counties, and only two of them count as "metropolitan" for regulatory purposes.
| Area | Who defines it | What it is built from | Where it shows up in CRA and HMDA work |
|---|---|---|---|
| Metropolitan Statistical Area (MSA) | OMB, in Bulletin 23-01 | Whole counties around an urban area of 50,000 or more people, joined by commuting ties | Its median family income is the CRA area median income for tracts in an MSA with no divisions. CRA assessment areas may not extend substantially beyond it. HMDA coverage for a bank, savings association or credit union requires a home or branch office in an MSA (12 CFR 1003.2). |
| Metropolitan division (MD) | OMB | Smaller groups of counties inside an MSA with a single core of 2.5 million or more people. The bulletin lists 37. | Where an MSA is split, the MD's median family income replaces the MSA's as the CRA area median income. Regulation C's geography rule names an "MSA or MD" (12 CFR 1003.4(a)(9)(ii)). |
| Micropolitan Statistical Area | OMB | Whole counties around an urban area of at least 10,000 but less than 50,000 people | Not an MSA. The CRA rule defines a nonmetropolitan area as "any area that is not located in an MSA," so micropolitan tracts are measured against the statewide nonmetropolitan median family income. |
| Nonmetropolitan county | Defined by what it is not: any county outside an MSA | Whole counties, including micropolitan counties and the 1,300 counties OMB places in no statistical area | Tracts use the statewide nonmetropolitan median family income. Middle-income nonmetropolitan tracts can be designated distressed or underserved. HMDA geography fields are required here only for institutions that also report CRA data (12 CFR 1003.4(e)). |
How states, counties, MSAs and census tracts nest
The geography stacks in a fixed order. A census tract is a subdivision of a county, and state and county lines are always tract boundaries (our census tract explainer covers how tracts are drawn). Counties are the building blocks of MSAs and MDs. Because a whole county belongs to at most one MSA, every tract inside it inherits exactly one state, one county and one MSA or MD, or none if the county is nonmetropolitan.
An MSA can cross a state line. A county cannot. A multistate MSA therefore holds counties from two or more states, and its tracts still carry their own state code. That matters for assessment areas, as the rule below shows.
The MSA/MD code is not part of the eleven-digit tract number on a HMDA record. It follows from the county, which is why the FFIEC Geocoding System returns the MSA or MD alongside the state, county and tract.
MSA/MD median family income and tract income levels
The CRA regulations sort tracts into four income levels by comparing the tract's median family income with the "area median income." The area median income is the median family income of the tract's MSA, or of its MD if the MSA has been divided, or the statewide nonmetropolitan median family income if the tract is outside any MSA (12 CFR 228.12(b)). The income levels in 12 CFR 228.12(m) are:
- Low-income: tract median family income "less than 50 percent" of the area median income.
- Moderate-income: "at least 50 and less than 80 percent."
- Middle-income: "at least 80 and less than 120 percent."
- Upper-income: "120 percent or more."
The OCC's 12 CFR 25.12 and the FDIC's 12 CFR 345.12 use the same lines. To classify one tract, enter its percentage or the two dollar figures in our CRA tract income level classifier.
The FFIEC does this arithmetic for every tract and publishes the result with its census data. According to the FFIEC, the tract's median family income comes from the five-year American Community Survey and "remains static for five years." The MSA or MD figure comes from the same survey and "normally remains unchanged for 5 years unless OMB boundary updates occur." That second clause is how an OMB decision ends up in your CRA tables.
How MSA boundaries shape a CRA assessment area
First, which rule applies. eCFR now prints the CRA rule the agencies adopted in October 2023, but a federal court enjoined it on March 29, 2024. In January 2026 the Federal Reserve and FDIC wrote that the 2023 rule "is currently enjoined. As such, the legacy CRA regulations ... remain in effect" (Federal Register document 2026-00042). The OCC and FDIC's August 12, 2026 proposal confirms banks are evaluated under the 1995 regulations and says it "would also leave the current assessment area framework largely unchanged." So the quotes below come from the legacy text as of March 29, 2024: 12 CFR 228.41 (Federal Reserve), with the same limits in 12 CFR 25.41 (OCC) and 12 CFR 345.41 (FDIC). Which performance tests apply inside the area depends on the bank's CRA asset-size category.
Whole census tracts
An assessment area "must consist only of whole geographies," and a geography is "a census tract delineated by the United States Bureau of the Census in the most recent decennial census" (§ 228.41(e)(1) and § 228.12(k)). A bank may trim an assessment area to "only the portion of a political subdivision that it reasonably can be expected to serve," which the rule says is especially appropriate for an area that would otherwise be "extremely large, of unusual configuration, or divided by significant geographic barriers" (§ 228.41(d)). Even a trimmed area has to follow tract lines.
MSA and state boundaries
An assessment area must "consist generally of one or more MSAs or metropolitan divisions (using the MSA or metropolitan division boundaries that were in effect as of January 1 of the calendar year in which the delineation is made) or one or more contiguous political subdivisions, such as counties, cities, or towns" (§ 228.41(c)(1)). It also "may not extend substantially beyond an MSA boundary or beyond a state boundary unless the assessment area is located in a multistate MSA" (§ 228.41(e)(4)).
When a bank's market does spill across a line, the rule tells it to split: separate assessment areas "for the areas in each state," and separate ones "for the areas inside and outside the MSA." A branch network that straddles an MSA's edge therefore ends up with at least two assessment areas, and each one is measured against its own median income.
What examiners check
The rule says the agency does not grade the delineation "as a separate performance criterion" but "reviews the delineation for compliance with the requirements of this section" (§ 228.41(a)). Beyond whole tracts and boundaries, an assessment area must include the tracts with the bank's main office, branches and deposit-taking ATMs, plus surrounding tracts where it made or bought a substantial portion of its loans. It "may not reflect illegal discrimination" and "may not arbitrarily exclude low- or moderate-income geographies, taking into account the bank's size and financial condition" (§ 228.41(c)(2), (e)(2) and (e)(3)). If the delineation fails those tests, the agency does not have to use it (§ 228.41(g)).
Fair lending reviews are a separate matter and look past the assessment area. Our page on redlining analysis, REMA and the assessment area explains why examiners use the reasonably expected market area instead.
When OMB changes MSA delineations, and what moves in your data
OMB revises the delineations by bulletin. Bulletin 23-01 replaced Bulletin 20-01 of March 6, 2020, and its delineations took effect immediately. The Census Bureau's list of OMB bulletins still shows 23-01 as the latest.
The FFIEC does not switch right away. Its overview says it "always adopts the latest OMB MSA boundary changes in the following calendar year." For Bulletin 23-01 that meant the 2024 census data, "effective for data collected on or after January 1, 2024." According to the FFIEC, a boundary change affects three values: the MSA/MD median family income, the FFIEC Estimated MSA/MD median family income, and the tract income level that depends on the first one.
After an OMB update, four things are worth rechecking.
- Tract income levels. When a county joins or leaves an MSA, the median moves, and so does every ratio built on it. A tract can cross the 50, 80 or 120 percent line with no change in the tract. The FFIEC notes that only tracts with a known income level can change this way.
- A county that moves into an MSA starts comparing against the MSA median instead of the statewide nonmetropolitan one, and the reverse is true for a county that leaves.
- Any peer comparison you defined by MSA or MD now covers a different set of counties, so year-over-year market share may not compare like with like.
- Assessment-area maps. The rule ties a delineation to the MSA boundaries in effect on January 1 of the year it is made. An assessment area described as "the whole MSA" may need redrawing, and one that sat inside an MSA may now cross its edge.
OMB is not the only trigger. The FFIEC refreshes its income data every five years, in years ending in 2 and 7, so its next refresh is 2027. The Census Bureau redraws tracts every ten years. Our census tract explainer covers both schedules.
Where MSA/MD codes come from in practice
For one address, the FFIEC Geocoding/Mapping System is free. It returns the MSA or MD, state, county and tract, plus the tract's income level, for an address and activity year. Our guide to the FFIEC Geocoding System explains each field. As that guide notes, the FFIEC's FAQ says the system has no batch option.
A whole LAR or CRA file is a different job. RATA's batch geocoding service takes a file of addresses and returns it with a census tract, MSA and county code on every record, at the 98%+ accuracy described in how RATA measures geocoding accuracy. GeoPlus files come back in two to three business days.
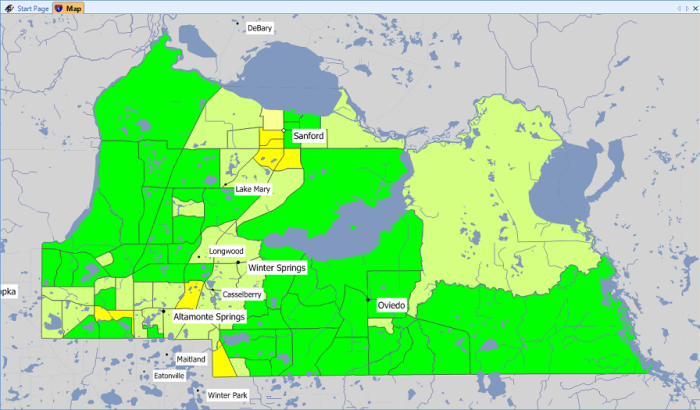
For the assessment-area map itself, Comply Mapping generates an FDIC-specification CRA assessment area map with tracts shaded by income level. Its layers include tracts, MSA/MDs and counties, and the map is regenerated rather than redrawn when a boundary or an income band changes.
If you would rather not run the software on your own servers, RATA Hosted Services is the no-install option: RATA hosts the same Comply software so the institution avoids on-site installation, database maintenance and manual software updates.
Frequently asked question
How can I see on a CRA eligibility map whether a tract is low- or moderate-income?
For a single tract, look up the address in the FFIEC Geocoding/Mapping System, which returns the tract's income level, or enter the tract's median family income percentage in our CRA tract income level classifier. Low- and moderate-income tracts are the ones under 80 percent of the MSA/MD median. To see every tract in your assessment area at once, Comply Mapping shades the whole area by tract income level on one map.
Want to see your own assessment area mapped with MSA, county and tract codes? Schedule a Comply Mapping demo or call 407-831-7282.
Sources
- OMB Bulletin No. 23-01, Revised Delineations of Metropolitan Statistical Areas, Micropolitan Statistical Areas, and Combined Statistical Areas
Office of Management and Budget, July 21, 2023. Read November 17, 2026. - About Metropolitan and Micropolitan Statistical Areas and OMB Bulletins
U.S. Census Bureau. Read November 17, 2026. - FFIEC Census Data Overview
Federal Financial Institutions Examination Council. Read November 17, 2026. - 12 CFR 228.12, Definitions and 12 CFR 228.41, Assessment area delineation (legacy CRA rule as of March 29, 2024)
eCFR. Read November 17, 2026. Matching sections: 12 CFR 25.12 and 25.41 (OCC), 12 CFR 345.12 and 345.41 (FDIC). - Community Reinvestment Act Regulations Asset-Size Thresholds
Federal Reserve and FDIC, Federal Register document 2026-00042, January 7, 2026. - Community Reinvestment Act Regulations, proposed rule
OCC and FDIC, Federal Register document 2026-16454, August 12, 2026. - 12 CFR 1003.2 and 12 CFR 1003.4 (Regulation C)
eCFR. Read November 17, 2026.
Photo from Rawpixel via Openverse, public domain (CC0 1.0).

- What Is an MSA? Metropolitan Statistical Areas, Census Tracts and Your Community Reinvestment Act (CRA) Assessment Area
- 2025 Community Reinvestment Act (CRA) Small Business, Small Farm and Community Development Lending Data: What Changed and What to Do Next
- The CFPB's Semiannual Report: What Narrower Federal Enforcement Means for Fair Lending, HMDA and Community Reinvestment Act (CRA) Programs
- How to Choose Section 1071 Software: What to Test Before Your First Filing
- The Regulation B Lawsuits: What Your Fair Lending Program Should Keep Doing While the Rule Is in Court
- November 2026
- October 2026
- September 2026
- August 2026
- March 2026
- February 2026
- January 2026
- 2025
- 2022
- 2021
- 2020
- 2017
- California's New Fair Lending Exam Law: What State-Chartered Banks, Credit Unions and Mortgage Licensees Should Have Ready
- HMDA vs CRA vs Section 1071: What Each Rule Collects and Who Has to File
- 2026 HMDA Data: Your Filing Checklist for the March 1, 2027 Deadline
- Fair Lending Regression Analysis: What It Controls For and How to Explain a Pricing Disparity
- How to Evaluate Fair Lending and CRA Software: What to Test Before You Sign
- What a Fair Lending Exam Actually Asks For
- What Actually Counts as a Small Business Loan Under Section 1071
- Section 1071 in 2026: What Lenders Need to Know About Small Business Lending Data
- How to Benchmark Your CRA and HMDA Lending Against Peer Data
- Special Report: Geocoding - Achieving the Highest Accuracy

